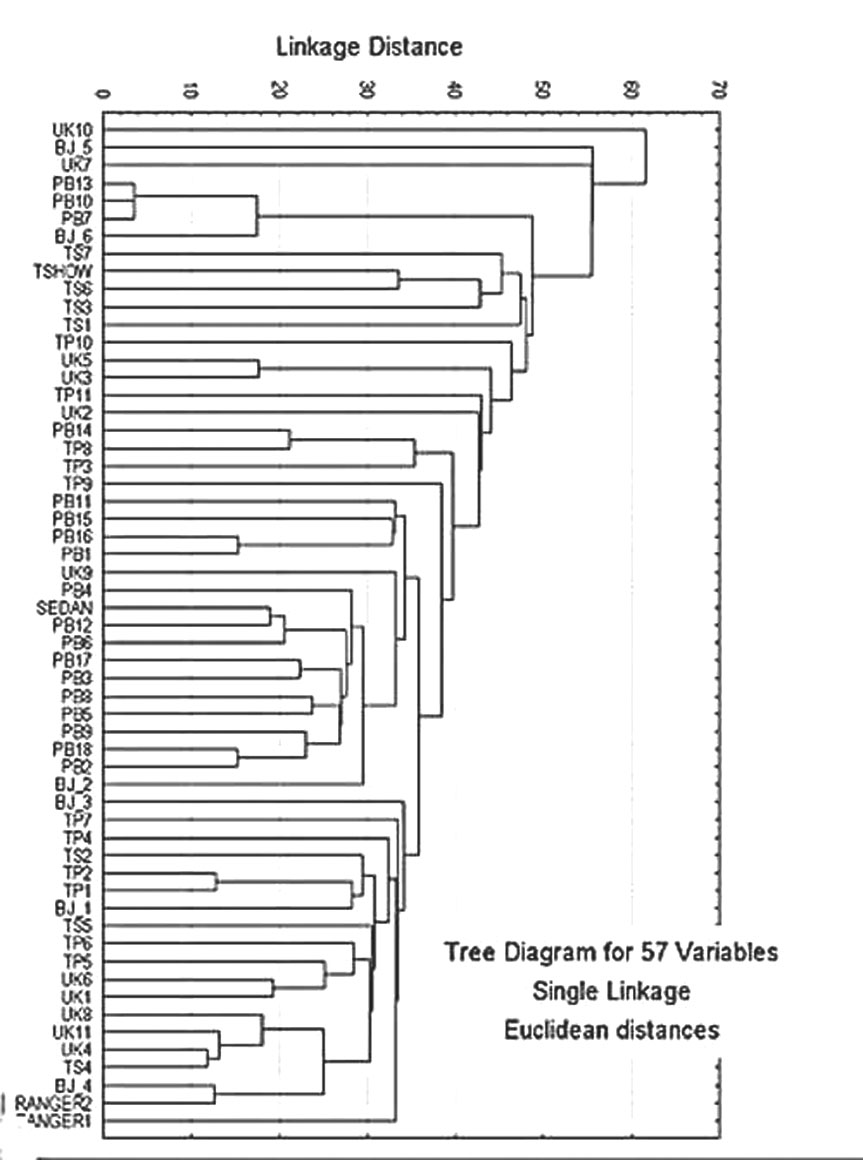
This chart compares nuclear tests in terms of production
of radionuclides. Nuclear tests that produced similar radionuclide spectrums
are grouped more closely together than are those that produced different
spectrums. This cluster method uses theEuclidian Distance method to determine
similarities and differences between the variables.
RANGER = Ranger series 1951; BJ = Buster-Jangle Series
1951; TS = Tumbler-Snapper Series 1952; UK= Upshot-Knothole Seies, 1953;
TP = Teapot Series 1955; PB = Plumbbob Series 1957. SEDAN = shot SEDAN, detonated
July 8, 1962. Number values refer to the number of the individual test in
the series. For example, TP6TFA refers to the Total Fallout values for the
sixth test in the 1955 nuclear test series code-named Teapot.